Recent Posts
zimslog
[R] Scatter plot with Regression lines (ggplot2) 본문

- 데이터 집계 및 피벗
 # count Patients
 a <- data[,c(3,39,43)] %>%
   group_by(age_group2, year) %>%
   summarise(n_patient = n())

 # pivot wider
 b <- a%>%
   dcast(year ~ ..., value.var = 'n_patient')
patient_id year age_group2
<chr> <int> <fct>
1 0005969 2014 61-75
2 0010250 2019 >=76
3 0013541 2011 >=76
4 0013600 2011 46-60
5 0024285 2016 46-60
6 0025533 2018 61-75 > head(a)
# A tibble: 6 × 3
# Groups: age_group2 [1]
age_group2 year n_patient
<fct> <int> <int>
1 <31 2011 1
2 <31 2012 1
3 <31 2013 4
4 <31 2015 4
5 <31 2016 4
6 <31 2017 4> head(b)
year <31 31-45 46-60 61-75 >=76
1 2010 NA 2 10 5 4
2 2011 1 7 12 10 5
3 2012 1 4 8 17 14
4 2013 4 10 15 25 17
5 2014 NA 11 24 23 7
6 2015 4 14 17 24 9
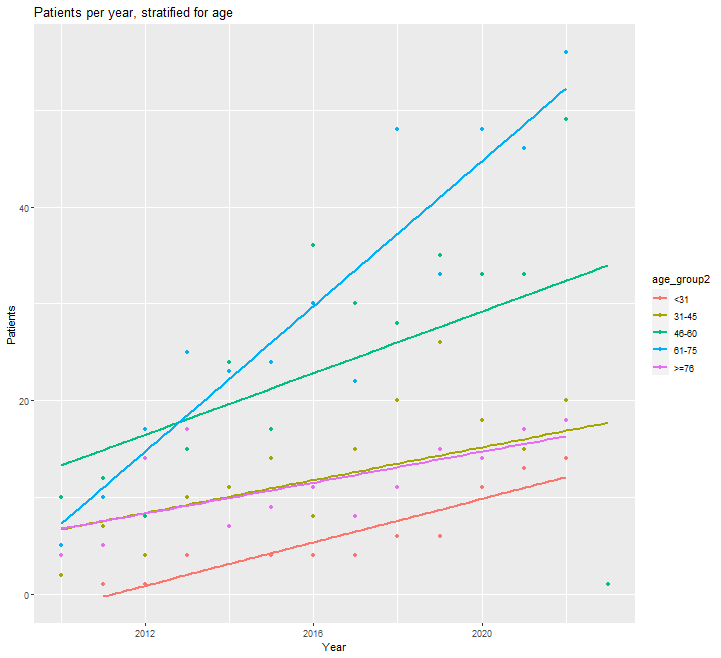
- 회귀선을 포함한 산점도
# scatter plot with regression lines
 ggplot(data=a, aes(y = a$n_patient, x= a$year, color=age_group2)) +
   geom_point() +
   geom_smooth(method = 'lm', se=F)+
   labs(title = 'Patients per year, stratified for age',
        x = "Year",
y = "Patients")'Data Analysis > R' 카테고리의 다른 글
| [R] 그룹 별로 정규성 검정 (shapiro_test, group_by, qqplot) (0) | 2024.01.17 |
|---|---|
| [R] Cohen's Kappa (카파상관계수) (0) | 2024.01.12 |
| [R] CCA, Canonical Correlation Analysis (정준상관분석) (0) | 2024.01.08 |
| [R] Logistic Regression Probability Curve (0) | 2023.12.24 |
| [R] Diagnostic Test (진단 테스트) (2) 진단 도구 간 성능 비교 (0) | 2023.12.12 |


